Liangxi Ding1, Qijun Du2, *
1Nanchang Institute of Technology, Jiangxi 330044, China
2School of Computer Science, North China Institute of Science and Technology, Beijing 101601, China
*Corresponding email: dujun@ncist.edu.cn
https://doi.org/10.71052/geb2025/XTRC7964
Abstract
With the rapid rise of China’s artificial intelligence industry, with the rapid development of the Internet industry, a huge amount of data has been accumulated and the progress of data mining and utilization technology has been made. The effects of data, technology and policies are superimposed on each other, which has spawned a large number of new artificial intelligence enterprises. With the rapid arrival of the network information society, using the advantages of big data to break the limitations of traditional education evaluation has become the reality and technical logic of the integrated development of information technology and education evaluation. In the specific application, it is mainly presented as education and teaching quality evaluation, learning behavior effect evaluation, management service quality evaluation, government education policy performance evaluation, etc. The development of modern science and technology provides all-round support for the establishment of scientific education evaluation. The deep integration of artificial intelligence, big data and education plays an important technical supporting role in the reform of education evaluation. With the in-depth development of information technology, technologies such as the Internet, Internet of Things, and cloud computing have successively become commonly used technologies in people’s daily work and life. In the education industry, informatization construction promotes education construction from application-driven to data-driven, and campus construction moves from “digital campus” to “smart campus”. And all this has brought about a change, that is, the explosive growth of the amount of data. The arrival of the era of big data brings not only opportunities but also challenges to the development of all walks of life. Postgraduate education is the highest level of higher education and plays a vital role in the social development, technological and economic development of China. Under the current trend of rapid development of the Internet and the diversification of evaluation subjects, how to evaluate the quality of postgraduate education has become the focus of scholars. This study uses big data to construct a quality evaluation index system for postgraduate education by using AHP and proposes strategies to improve the quality of postgraduate education in China.
Keywords
Big data, Postgraduate, Education quality, Education quality evaluation, Analytic hierarchy process, Secure algorithms, Methodologies for mobile application security
Introduction
The deep integration of big data technology and regional education evaluation is the key to accelerating the transformation and development of data-driven teaching paradigm. In order to make the data platform more perfect, we need to combine the depth and breadth of data to build a regional education evaluation system. In the report of the 19th National Congress of the Communist Party of China, it is clearly stated that “prioritizing the development of education”. In the continuous construction and application of information, the education industry has accumulated a large amount of rich data. These data sets cover all aspects of teaching, resources, management, scientific research, and services. Data collection and recording have become the norm [1]. Educational data provides a solid multi-dimensional data foundation for the extensive development and in-depth research of education. “Data” has become a quantitative tool for education and teaching research, and breakthroughs in storage technology have made data a scientific force for innovative education and teaching methods. Under the call of national policies, the research and application of educational data has reached an unprecedented level. Educational data has great potential in promoting scientific decision-making in education, promoting educational innovation, and optimizing educational quality management [2-4].
However, due to the fragmentation of business systems, the lack of top-level planning, and the lack of unified standards in the education industry in the early stage of informatization construction, the massive educational data cannot be integrated and shared due to irregularities and inconsistencies in its use. Data quality issues need to be resolved urgently. Improving data quality is an important measure to promote the current educational data to play its value. The purpose of data governance is to remove the false and preserve the true, to integrate the chaotic and disordered data analysis, to reduce the complexity and simplify it, to improve the quality of data, and to give full play to the potential value of data. Through education data governance, extensive and in-depth mining of data value can promote scientific decision-making in education, precise education management, and personalized teaching activities. Data governance is a necessary means to realize the value-added of educational data assets. Through data governance, educational governance capabilities can be improved, the development of the education industry can be promoted, and a new ecology of smart education can be built [5-7]. Data governance can integrate data of different types, properties, and sources, mine the correlation between data, and give full play to the potential value of data.
Internet education is participating in the reform of future education and has become an important educational form to promote educational reform. Since the end of the 20th century, informatization, represented by the rapid development of computer technology, network technology, and communication technology, is causing profound changes in the world, reshaping the new pattern of world politics, economy, culture and society, and also triggering the field of education. This is not only reflected in the changes in human learning methods and thinking methods, but also in the manifestations of courses, classroom teaching organization forms, school management methods, teaching evaluation methods and educational management models. Internet technology, as the key technology of education informatization, is revisiting education. Internet education is a new form of education and is participating in the transformation of future education. The process is long and requires the continuous integration of technology and education. Looking back at the history of the integration of the Internet and education, we can find that the impact of Internet technology on the education industry is gradual. In 1984, the traditional asynchronous online course in the United States opened the precedent of Internet education. Subsequently, countries around the world recorded the application and practice of the Internet in education from the perspectives of “open education”, “network education”, “distance education” and “online education”. In 2012, the rapid rise of Internet online courses represented by MOOCs has become a new beginning of Internet education. The emergence of new technologies and new education methods such as Khan Academy, big data, micro-classroom, micro-credit, micro-degree, flipped classroom, and gamification teaching has subverted the application of the Internet in “traditional” education. The reshaping of education by the Internet and the mobile Internet is not only reflected in the expansion of educational resources and the provision of new teaching models and methods for education, but also in the changes in the way humans think about education. The most important thing is the relationship between the Internet and education. Integration brings new ideas and motivation: Internet education is participating in the future educational reform, and Internet education has become one of the main educational forms of educational reform.
The postgraduate education evaluation system in China first began in the era of planned economy. With the continuous development and reform of the social economy, culture and politics, the development scale and type of postgraduate education and the quality concept have also undergone important changes. In recent years, the influence of the Internet on education has been deepening. The previous education evaluation system was in urgent need of improvement or even reform because it does not adapt to the development of the current society. In particular, the current postgraduate education has begun to develop beyond the norm, and it is very important to cultivate high-level innovative talents to ensure a high quality of education while developing. Because of the influence of COVID-19, many universities have opened online graduate teaching courses. Building the system to evaluate these kinds of graduate teaching is urgent and necessary. This study deeply analyzes the influencing factors and areas for improvement of postgraduate education quality evaluation under the background of “Internet +” and constructs and improves the education quality evaluation system in China [8-10].
Method and theory
System indicators deleted
On the one hand, big data can completely record the education process and realize value-added evaluation and comprehensive evaluation. Big data has the characteristics of massive data scale, diverse data types, fast data processing and real high-quality data. It provides various data collection, cleaning, classification and analysis for education, teaching and management services, so as to realize the data recording, interactive participation and effect bearing of process education teaching and online learning, and objectively and truly record education, teaching and learning The whole process of learning process and management service as well as the analysis of “evidence-based education and teaching”, and the educational evaluation model and effect oriented to diverse needs can be empirically tested for many times. Based on the data of teaching and learning process, it can realize the value-added evaluation that reflects the efforts and progress of teachers or students, as well as the comprehensive evaluation of students’ all-round development in moral, intellectual, physical, artistic and labor, and provide scientific and technological support for educational evaluation; On the other hand, big data can provide more comprehensive and systematic education evaluation and promote students’ growth. In terms of problems or objects, education big data evaluation can overcome the shortcomings of traditional education evaluation in quantitative research, such as incomplete data collection, unrepresentative or authentic sample selection, and systematically record, depict and present the operation of the education system with full samples and the whole process, covering the multi-dimensional behavior data of students’ interests, hobbies and aspirations as the main body of education, so as to build a digital The new empirical education system and the intelligent evaluation system that perceives the all-round development of students have become new cognitive tools to discover, demonstrate and grasp the education laws and students’ growth laws in the era of big data.
This study refers to the opinions of education experts at home and abroad and summarizes and integrates the evaluation index system of postgraduate education quality. Among them, the postgraduate factors include five indicators: the quality and ability of students, the proportion of papers published, the quality of graduation thesis, the level of scientific research projects and the level of foreign languages. Tutor factors include the tutor’s age and professional title, tutor’s educational background, teacher-student ratio, tutor’s academic level, work attitude and sense of responsibility, and teacher-student relationship. School factors include the scientific nature of teaching management mechanism, subject quality, per capita experimental equipment, per capita books and subject funding. The social factor indicators include the employment rate within three months of graduation, the weighted average salary of graduates for three years and employer satisfaction.
In this study, the questionnaire survey method is used to collect data, and a postgraduate education quality index system is constructed. Based on the questionnaire, the postgraduate education quality evaluation index system and the importance of indicators at all levels are modified, referring to the scoring method 1-9 and its reciprocal standard. This survey uses a combination of online and offline questionnaires, and distributes the questionnaires through the domestic questionnaire platform, and organizes school graduate students, tutors, graduates, postgraduate education leaders, and employers to participate in the questionnaire. A total of 400 questionnaires are distributed, including 200 for graduate students, 50 for graduates, 50 for supervisors, and 100 for employers. Finally, 350 valid questionnaires are obtained, and the recovery rate is 87.5%, among them 180 for graduate students, 40 for graduates, 40 for supervisors, and 90 for employers.
After considering postgraduate factor indicators, tutor factor indicators, school factor indicators, social factor indicators and big data indicators, we have established an education system based on big data algorithms. The specific evaluation index system of postgraduate education quality is shown in Table 1.
Table 1. The evaluation index system of postgraduate education quality.
| First-level indicator | Secondary indicators | Third-level indicator | Nature | |
| Quality of graduate education | Graduate factors | Ability and quality | Including students’ innovation ability, communication ability, teamwork ability, ideological and morality, theoretical basis, work ability, etc. | |
| Published paper level | The number and proportion of papers indexed by SCI, EI and ISTP per capita, and the number of papers published in domestic core journals per capita | |||
| Dissertation quality | Number of outstanding papers/total number of dissertations | |||
| Research project level | The number of scientific research projects per capita and the number of academic conferences per capita | |||
| Foreign language level | The number of English exams passed/total number of students | |||
| Mentor Factor | Mentor age and title | Proportion of young teachers to teachers = young teachers/total number of teachers. Teachers with senior professional titles = number of teachers above associate high school / total number of teachers | ||
| Tutor degree | The ratio of teachers with doctoral degrees to teachers = number of teachers with doctoral degrees / total number of teachers | |||
| Teacher-student ratio | Number of tutors/numbers of graduate students | |||
| Tutor’s Academic Ability | Research achievements, research projects, and research funding scale | |||
| Work Attitude and Responsibility | Guidance size, manner and frequency | |||
| Teacher-student relationship | Satisfaction between teachers and students | |||
| School factor | The scientific nature of teaching management mechanism | Sound teaching management organization, sound teaching rules and regulations, curriculum setting, training plan | ||
| Subject level | Number of disciplines and majors, number of key disciplines and key laboratories | |||
| Scientific research equipment per capita | Value of teaching and scientific research equipment per capita = total value of teaching and scientific research equipment / number of students | |||
| Books per capita | The total number of books per capita / the number of students | |||
| Per capita education expenditure | Education expenditure per capita = (total expenditure for the whole year minus those that have nothing to do with cultivating students | |||
| Social factors | Three-month employment rate after graduation | Three-month employment rate after graduation = number of employees three months after graduation / total number of graduates | ||
| Three-year weighted average salary after graduation | Three-year weighted average salary after graduation = total weighted salary / total number of graduates | |||
| Employer satisfaction | Employers’ evaluation of graduates’ job performance, practical ability, and moral level | |||
| Big data factor | Type of data collection | Learning information: learning process, educational resources, etc.; student personality information: physiological data, cognitive emotional state | ||
| data collection technology | The construction of intelligent universities, data dynamics and quality | |||
| Data Mining and Analysis Technology | The use of data mining technology, visual analysis |
System weight analysis
The concept of AHP
AHP is a multi-criteria decision-making method that deeply analyzes nature, influencing factors and internal relationships of complex decision-making problems. This method builds a multi-level structure model by combining qualitative and quantitative information and quantifies the thinking process of information acquisition through a certain limit of quantitative information, so that some complex decision-making problems such as multi-objective and multi-criteria problems can be solved. In this paper, the AHP is applied to the construction of the postgraduate education quality evaluation system, which is helpful to obtain more accurate evaluation results to reflect the postgraduate education quality. The postgraduate education quality index system is a multi-layer staggered evaluation index, and the target value in the system is relatively difficult to describe quantitatively. The use of AHP is to construct a judgment matrix and find the maximum eigenvalue to solve its decision-making problem.
Steps of analytic hierarchy process
Build a hierarchical model. Based on in-depth analysis of practical problems, relevant influencing factors are subdivided into several levels from abstract to concrete according to their connotations and characteristics. From low to high, each level of factor has a subordinate upper-level factor, which affects the upper-level factor and affects the lower-level factor. The highest-level factor is the target layer, generally there is only one factor, there will be one or several levels of factors in the middle to further subdivide the target factor, and the bottom layer is the program layer or the object layer.
Construct a contrast matrix. For each level of factors between the target level and the program level, the method of pairwise comparison is used to compare the factors at the same level and the factors that are subordinate to each other, by using a comparison scale to determine the pairwise comparison matrix down to the lowest level, as shown in Table 2.
Table 2. Quantitative standard of judgment matrix.
| Number | Explanation |
| 1 | The two factors are equally important in comparison |
| 3 | Compared with the two factors, the former factor is slightly more important |
| 5 | Compared with the two factors, the former factor is obviously more important |
| 7 | Compared with the two factors, the former is strongly important |
| 9 | Compared with the two factors, the former is extremely important |
| 2,4,6,8 | Represents the median value of adjacent judgments |
According to the sum method, we first sum up each column of the judgment matrix: Σi=1m aij; let bij = aij / Σi=1m aij. So as to calculate: wi = Σi=1n bij / n, so that: w = (w1, w2, w3, …, wn)T. This is calculated, and normalized to get.
We calculate the maximum eigenvalue, λmax, of each matrix. In order to reduce the influence of subjective judgment on the accuracy of aij value and reduce the error, this paper adopts the method of calculating the consistency ratio CR to test the consistency of the matrix, and the consistency index CI needs to be calculated.
The average random consistency index RI is obtained from Table 3.
Table 3. Values of the average random consistency index ri.
| n | 3 | 4 | 5 | 6 | 7 | 8 | 9 |
| RI | 0.58 | 0.9 | 1.12 | 1.2 | 1.32 | 1.41 | 1.45 |
Consistency ratio is.
When CR<0.10, it means that the judgment matrix is consistent, and when CR>0.1, it is necessary to adjust the judgment matrix to be appropriate.
Hierarchical total ranking generally refers to the ranking value obtained by calculating the relative importance of each factor at a certain level relative to all factors at the previous level. The process of checking the consistency of the total ranking of the hierarchy is the same as the total ranking of the hierarchy, and it is also carried out layer by layer from the highest level to the lowest level. If the single ranking consistency test index of several influencing factors in the C level relative to a certain influencing factor Bj in the previous level is Cij, then the corresponding average random consistency index is Rij, so the total ranking random consistency ratio of the C level is.
By analogy, when CR<0.10, it can be considered that the results of the total ranking of the hierarchy have satisfactory consistency, otherwise it is necessary to readjust the judgment matrix to make it have satisfactory consistency.
Results and discussion
The quality evaluation indicators of postgraduate education include quantitative and qualitative indicators. The organic combination of the two indicators can comprehensively and preparable evaluate the quality of postgraduate education. According to the conceptual connotation, influencing factors and relevant research results of postgraduate education quality, this paper selects the evaluation indicators of postgraduate education quality, and establishes a hierarchical model of postgraduate education quality through questionnaires. By taking a certain element in the postgraduate education quality evaluation system as the comparison criterion, the comparison between the two elements is carried out. According to the influence of different elements on the quality of postgraduate education, relevant experts in postgraduate education are invited to determine each indicator and its weight, and then according to the degree of influence of different elements on the quality of postgraduate education. These evaluation indicators are used to determine the judgment matrix.
Yaahp software is used to calculate the maximum eigenvalue and eigenvector of the comparative discriminant matrix, and the eigenvectors are normalized to obtain the relative importance weight coefficient and consistency ratio of the hierarchical single ordering. The weight coefficients of each factor of the secondary-level indicators are shown in Figure 1. Among them, the personal factor of postgraduate’s accounts for the largest proportion of more than 0.4. The influence of graduate tutors is second, accounting for about 0.2. Figure 1 shows that in the context of the Internet, big data has a relatively large impact on postgraduate education, exceeding 0.1. It proves that it is necessary to integrate big data into the education system.
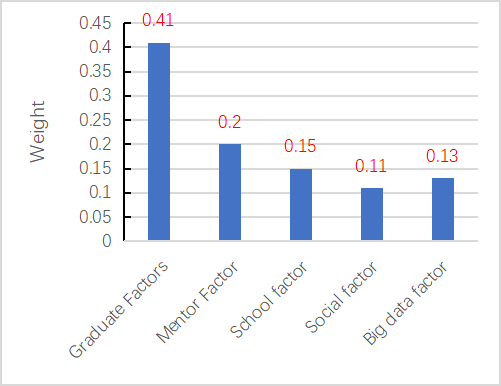
Figure 1. The weight of each secondary index factor.
We continue the analysis of the second-level indicators below each level of indicators, and the weights of the second-level indicators can be obtained. The results can be seen in Figures 2-6. Figures 2 to 6 show that the quality of papers, the academic level of teachers, the subject level of schools, the employment rate within three months of graduation, and data mining and analysis techniques are the most important factors that affect graduate students, tutor factors, school factors, social factor and big data factor, respectively.
In terms of graduate factors, the weight of dissertation quality is 0.27, which is higher than other factors, as shown in Figure 2.
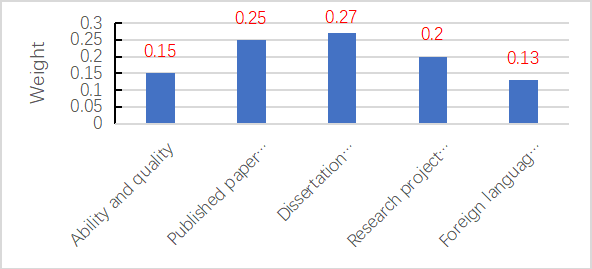
Figure 2. Weights of third-level indicators (graduate factors).
As for the tutor factor, the weight of academic levels is 0.4, which is higher than other factors, as shown in Figure 3.
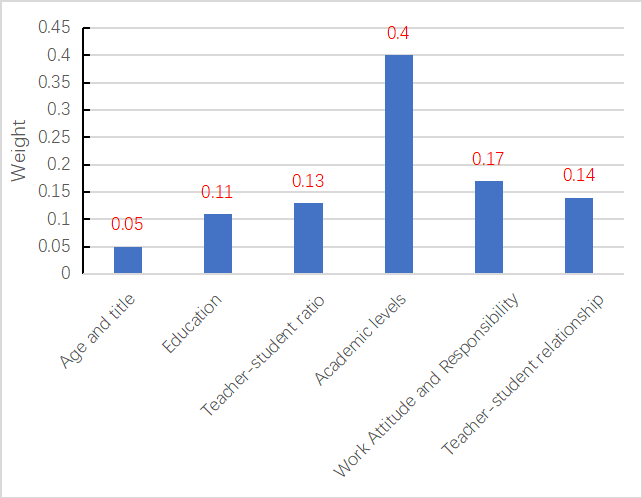
Figure 3. Weights of third-level indicators (tutor factor).
As far as the school factor is concerned, the weight of the subject level is 0.4, far exceeding other factors, indicating that the subject level is very important in the graduate student’s system. As far as the big data factor is concerned, data mining and analysis technology accounts for the largest share, which is 0.45. As shown in Figure 4.
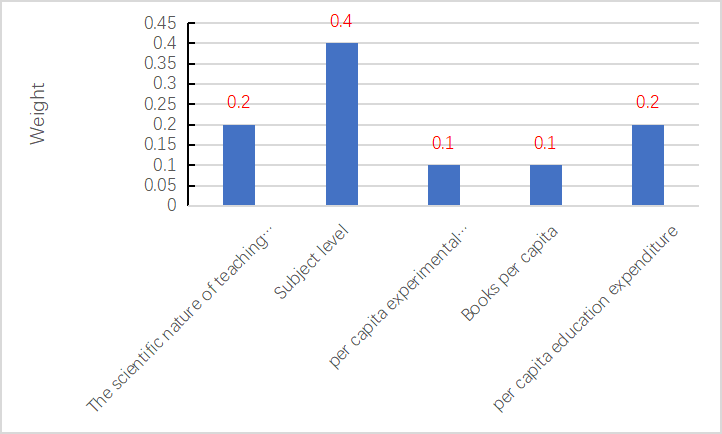
Figure 4. Weights of third-level indicators (school factor).
In terms of social factors, the weight of employment within three months after graduation is 0.55, which is higher than other factors, as shown in Figure 5.
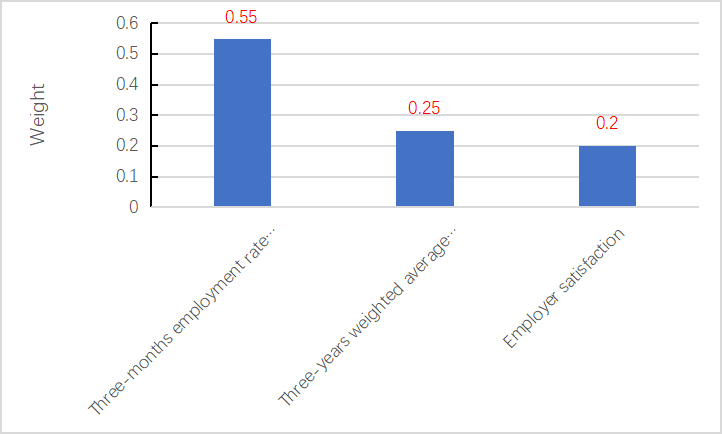
Figure 5. Weights of third-level indicators (social factor).
In terms of big data factors, the weight of data mining and analysis technology is 0.45, which is higher than other factors, as shown in Figure 6.
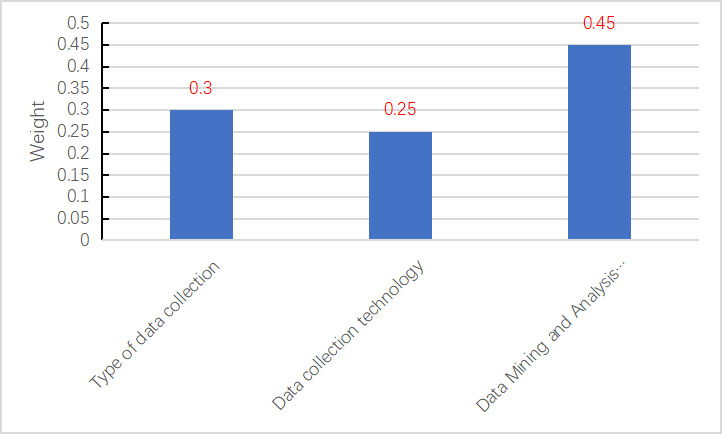
Figure 6. Weights of third-level indicators (big data factor).
According to the above-mentioned single ranking of the judgment matrix and the results of the weight coefficient assignment, the quality of postgraduate education can be calculated respectively.
The weight coefficient of the third-level index for the overall target in the weight coefficient of the quantitative comprehensive evaluation index is shown in Table 4. Table 4 shows that among all the influencing factors, the quality of graduate papers has the largest proportion.
Table 4. Weight system of comprehensive evaluation index of postgraduate education quality.
| Criterion layer | Weight | Indicator level | Indicator weight |
| Graduate factor | 0.41 | Ability and quality | 0.0615 |
| Published paper level | 0.1025 | ||
| Dissertation quality | 0.1107 | ||
| Research project level | 0.0820 | ||
| Foreign language level | 0.0533 | ||
| Mentor factory | 0.2 | Mentor age and title | 0.0100 |
| Tutor degree | 0.0220 | ||
| Teacher-student ratio | 0.0260 | ||
| Tutor’s Academic Ability | 0.0800 | ||
| Work Attitude and Responsibility | 0.0340 | ||
| Teacher-student relationship | 0.0280 | ||
| School factor | 0.15 | The scientific nature of teaching management mechanism | 0.0300 |
| Subject level | 0.0600 | ||
| Scientific research equipment per capita | 0.0150 | ||
| Books per capita | 0.0150 | ||
| Per capita education expenditure | 0.0300 | ||
| Social factors | 0.11 | Three-month employment rate after graduation | 0.0605 |
| Three-year weighted average salary after graduation | 0.0275 | ||
| Employer satisfaction | 0.0220 | ||
| Big data factor | 0.13 | Type of data collection | 0.0390 |
| data collection technology | 0.0325 | ||
| Data Mining and Analysis Technology | 0.0585 |
Students not only play the role of the main body of postgraduate education services, but also an important main body of quality assurance. In fact, education is a service industry, and students play the dominant position of consumers and customers that cannot be ignored. Universities need to maintain their survival through the improvement of educational service level and service quality. Simply expanding the scale of education and ignoring the quality of education cannot survive. Students as education consumers need high-quality teaching services in return for tuition fees, which means that graduate education quality assurance and evaluation need to pay attention to students’ opinions. However, in the actual education quality evaluation system, the students’ subject position is not well concerned and reflected. This study shows that the factors of postgraduates themselves account for the largest proportion in the entire system, indicating that we need to increase the cultivation of postgraduates’ own qualities.
Conclusion
With the rapid rise of China’s artificial intelligence industry, with the rapid development of the Internet industry, a huge amount of data has been accumulated and the progress of data mining and utilization technology has been made.
Based on AHP, this paper constructs a comprehensive evaluation index weight system for postgraduate education quality. The evaluation index is an organic combination of quantitative and qualitative indicators, which can comprehensively and prepare to evaluate the level of postgraduate education quality under the Internet background.
The quality of papers, the academic level of teachers, the subject level of schools, the employment rate within three months of graduation, and data mining and analysis techniques are the most important factors that affect graduate students, tutor factors, school factor, social factor and big data factor, respectively.
Acknowledgements
This work was supported by the financial supports from Humanities and Social Science Planning Project of Universities in Jiangxi Province of the year 2020《Research on virtual and practical teaching methods of Ideological and Political Theory courses on the basis of VR in universities》(Grant No:JC20111); and Planning Project of University Party Construction in Jiangxi Province of the year 2020《Research on Pattern Construction of VR+ Intelligent Party Building Positions》(Grant No: 20DJYB049)
References
[1] Swuste, P., Galera, A., Van Wassenhove, W., Carretero-Gómez, J., Arezes, P., Kivistö-Rahnasto, J., Van Den Broeke, C. (2021) Quality assessment of postgraduate safety education programs, current developments with examples of ten (post) graduate safety courses in Europe. Safety science, 141, 105338.
[2] Hamann, K., Glazier, R. A., Wilson, B. M., Pollock, P. H. (2021) Online teaching, student success, and retention in political science courses. European Political Science, 20(3), 427-439.
[3] Wang, Y., Lei, J. (2024) Influence of artificial intelligence on higher education reform and talent cultivation in the digital intelligence era. Scientific Reports, 15(1), 1-15.
[4] Al Ghatrifi, M. O. M., Al Amairi, J. S. S., Thottoli, M. M. (2023) Surfing the technology wave: An international perspective on enhancing teaching and learning in accounting. Computers and Education: Artificial Intelligence, 4, 100144.
[5] Liu, Y., Wang, Z. (2023) Application of machine learning algorithms in educational quality assessment: A case study of university courses. Journal of Educational Technology & Society, 26(2), 89-102.
[6] Chen, S., Wu, D. (2024) Enhancing educational outcomes through AI-driven analytics: A review of big data applications in higher education. Educational Research Review, 18(3), 215-230.
[7] Gao, L., Zhang, Y. (2022) Evaluating university teaching quality using data mining techniques. International Journal of Information Technology & Decision Making, 21(1), 123-138
[8] Zhang, R., Zhao, W., Wang, Y. (2021) Big data analytics for intelligent online education. Journal of Intelligent & Fuzzy Systems, 40(2), 2815-2825.
[9] Wang, M., Zhang, Z., Xu, M. (2021) Postgraduate training performance evaluation applying weighting and comprehensive fuzzy evaluation methods. International Journal of Emerging Technologies in Learning (iJET), 16(1), 124-133.
[10] Smith, J., Johnson, A. (2023) Artificial Intelligence and Big Data in Higher Education: A Review of Current Trends and Future Directions. Journal of Educational Technology, 27(1), 45-60.
Share and Cite
Ding, L., Du, Q. (2024) Evaluation and Analysis of University Education Quality Based on Internet Artificial Intelligence Big Data Algorithm. Global Education Bulletin, 1(1), 31–43. https://doi.org/10.71052/geb2025/xtrc7964